Created: 2022-07-11
Monitoring Query Performance of Retool Applications
Created: 2022-07-11
Having taken over a large Retool application developed by a host of web developers, we were asked to provide insight on how to optimize the overall sluggish experience of the clients' application. The app contains some 100+ queries and components, so in order to avoid having to search for the proverbial needle in the haystack, we approached the problem using data. Each query in Retool has a member called .queryRunTime, which contains both the runtime of the query consumed by the Backend as well as the Frontend.
This info is readily available in the Editor mode by exploring the individual queries, but the client needed to monitor the app in a production setting. In each app the client wished to monitor, we added the following to each query's onSuccess trigger:
recordQueryPerformance.trigger({
  additionalScope: { lastQuery: self, lastQueryTime: self.queryRunTime }
});
The recordQueryPerformance then consists of a REST query that itself is being dispatched to a Retool Workflow (see below).
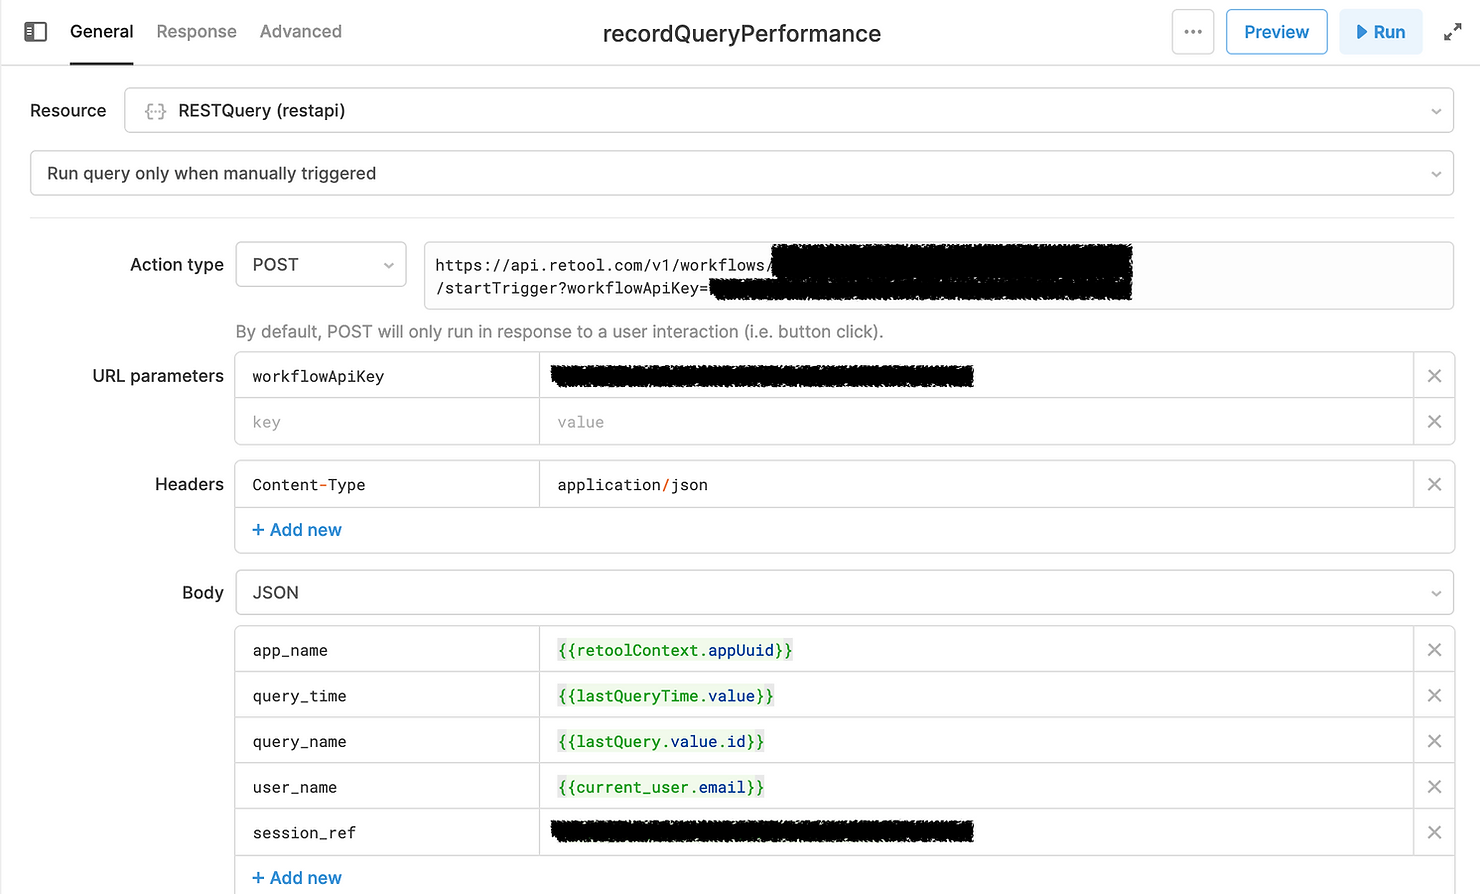
The workflow registers a Webhook within the client's retool instance of the form https://api.retool.com/v1/workflows/<instance_id>/startTrigger?workflowApiKey=<API_KEY>
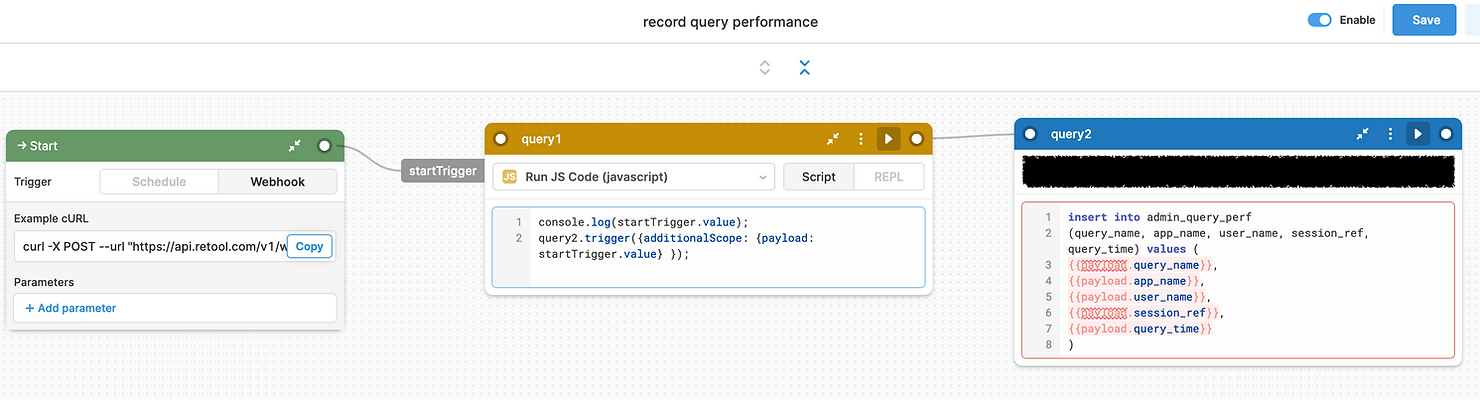
- A Retool Workflow endpoint received the data.
- Logged performance into
admin_query_perffor analysis.
Visualization
Built a dashboard in Retool to show query performance metrics live.
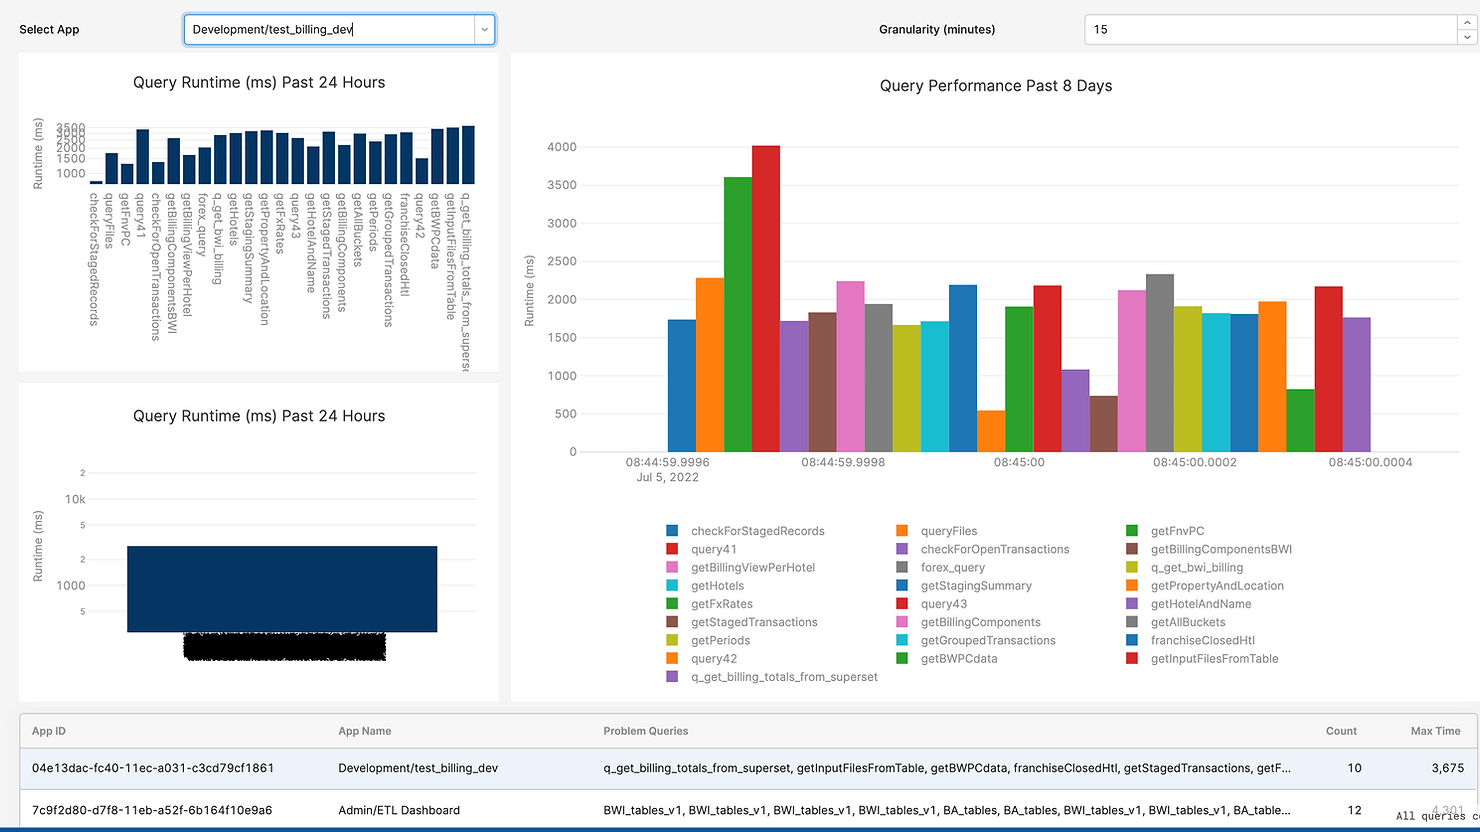
This enabled quick identification of performance bottlenecks and improved UX.